


FOOD INDUSTRY
in the Food Industry
Use Cases
Supporting the Field with Systems and Turning Changes on the Sales Floor into Business Opportunities
Streamlining visits, reports, and proposals for food manufacturers and food wholesalers into a single workflow
Supporting the field with systems,
Turning changes on the sales floor into business opportunities,
Streamlining visits, reports, and proposals for food manufacturers and food wholesalers,
into a single workflow
Do you have any of these problems?
-
I'm so swamped with data entry after getting back to the office that my focus on business negotiations logis waning.
-
We're still using an outdated system for daily reports, which continues to place a burden on both the field staff and management.
-
The items to be reported vary by store, and organizing photos and submitting reports to headquarters takes up a lot of time.
-
I can't see the status of deliveries or shelf restocking, so I can't determine which tasks to prioritize.
-
I’m so busy covering my existing routes that I don’t have time to focus on developing new business.
-
Even if we can see the level of activity, we can't determine the next steps or how to allocate resources across different areas.
WHAT UPWARD CAN DO FOR YOU
-
POINT01
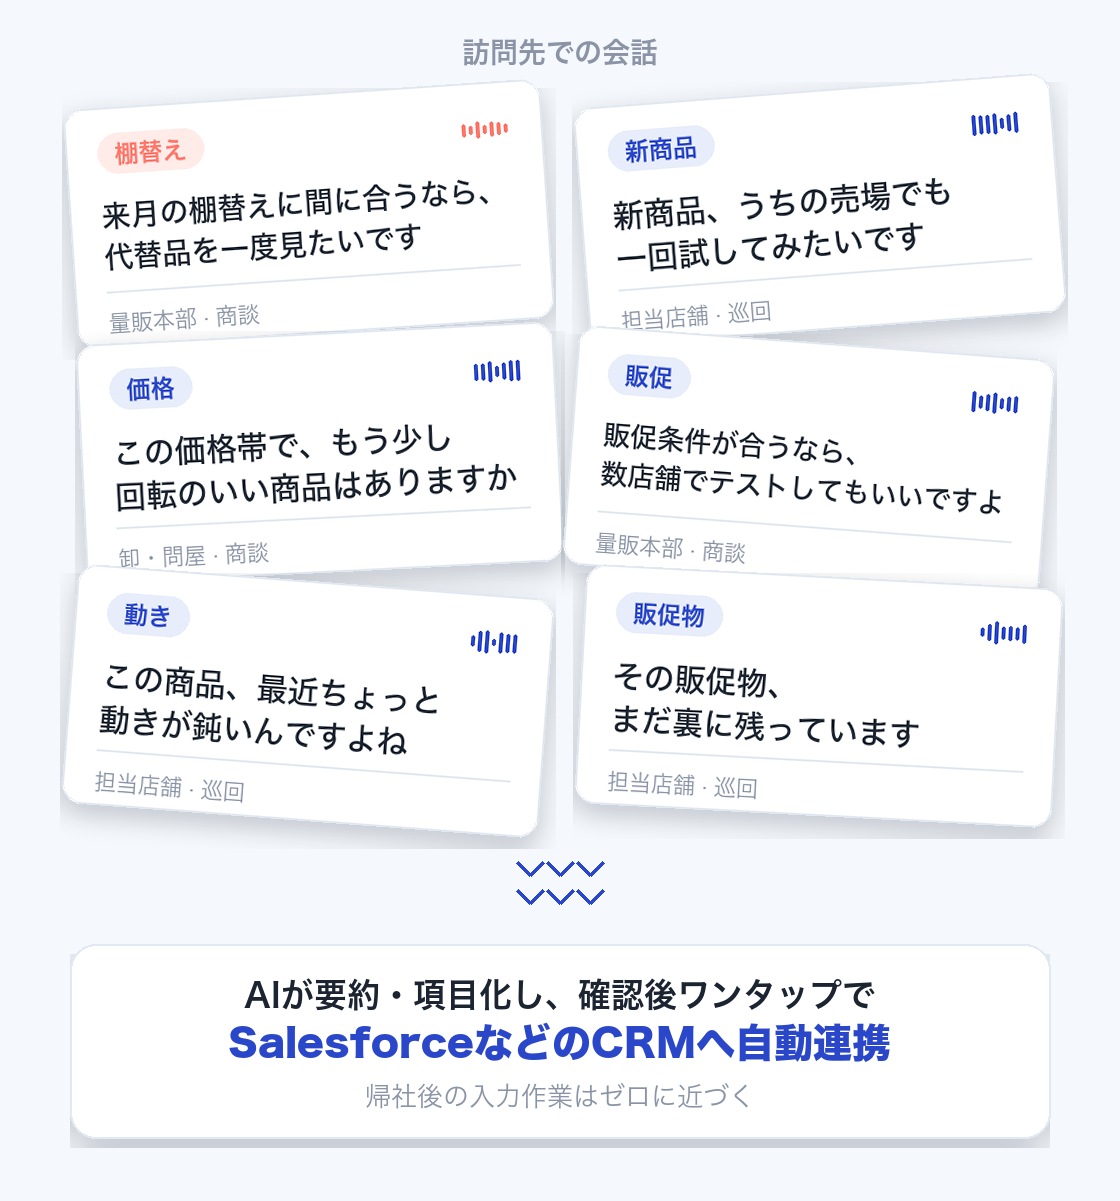
AI summarizes the details of business meetings and automatically syncs them with the CRM
AI summarizes the details of business meetings and automatically syncs them with the CRMAI Meeting Minutes (UPWARD AI Speech) detects when you arrive at a client’s location. With a single tap on the notification, you can record the sales meeting, and the AI will summarize and organize the key points before syncing them to a CRM such as Salesforce.
You can capture order signals—such as “If it’s ready in time for next month’s shelf restocking, I’d like to take a look at the replacement product”—without having to rely on your memory.-
Automate the process from detecting arrival at a destination to starting recording
Automate the process from detecting arrival at a destination to starting recording
-
Make sure not to overlook the timing for restocking, customer reactions to new products, and tasks for next time log
Make sure not to overlook the timing for restocking, customer reactions to new products, and tasks for next time log
-
Reduce data entry work after returning to the office to nearly zero
Reduce data entry work after returning to the office to nearly zero
-
Even with a high volume of visits, the level of detail in reports remains consistent.
Even with a high volume of visits, the level of detail in reports remains consistent.

-
-
POINT02
Consolidate Daily Reports and Activity Reports into the CRM
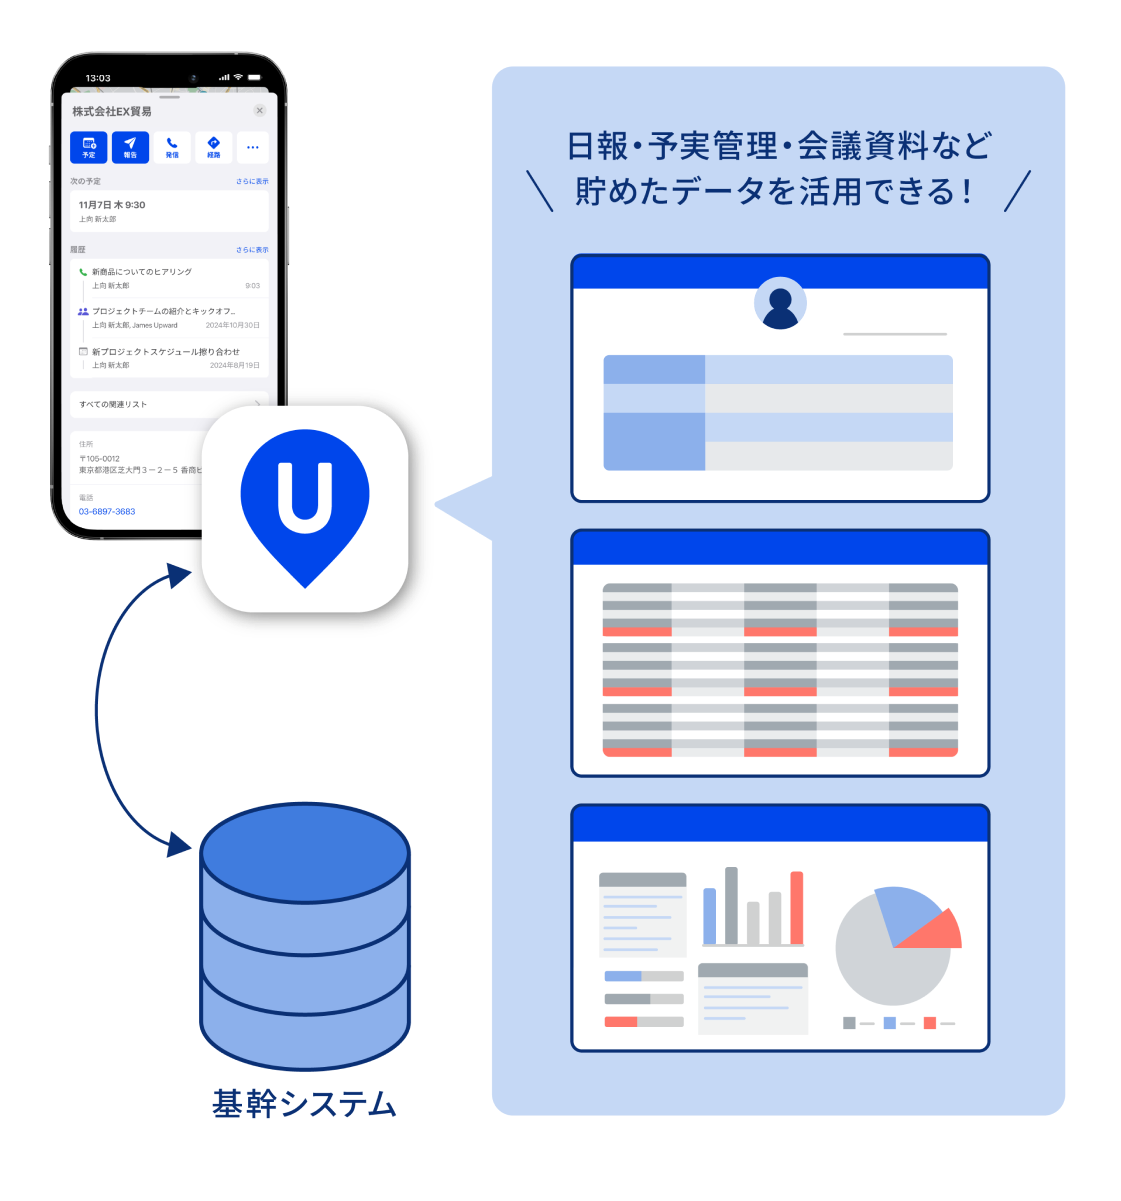
Consolidate Daily Reports and Activity Reports into the CRMWe consolidate activity reports—which have long been scattered across daily report systems and personal notes—into a CRM system such as Salesforce. Everything from the client’s website ( log) and photos to follow-up tasks is stored in one place.
Since data entry can be completed entirely on a smartphone, there’s no need to return to the office just to file a report.-
Consolidate daily reports and activity reports into the CRM to eliminate duplicate data entry
Consolidate daily reports and activity reports into the CRM to eliminate duplicate data entry
-
You can view the visit history for each client in chronological order.
You can view the visit history for each client in chronological order.
-
Reducing Information Loss During Staff Changes
Reducing Information Loss During Staff Changes
-
Rolling out Successful Proposals to Other Areas
Rolling out Successful Proposals to Other Areas
-
-
POINT03
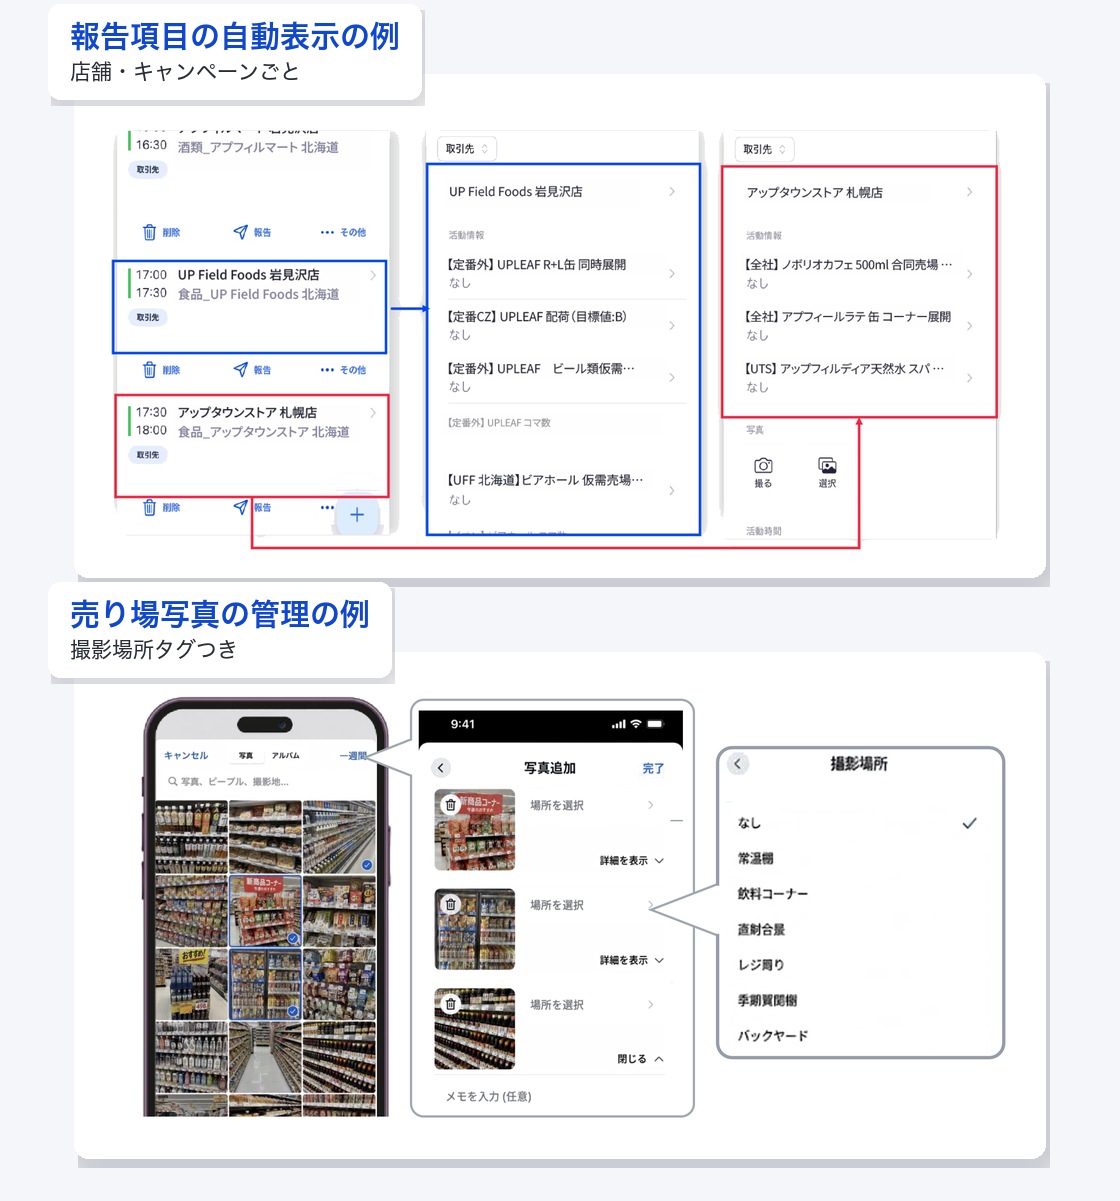
Automatically generate different report items for each store
Automatically generate different report items for each storeFor each store and campaign, the app displays only the reporting items needed at that moment on your smartphone. Photos of the sales floor are tagged with their location and linked to the visit at log, eliminating the need to organize photos after returning to the office.
Headquarters can easily distinguish between stores targeted for the initiative and those where it has already been implemented by color-coding, preventing any oversights or omissions in the implementation of the initiative.-
Display only the reporting items required for each store and campaign
Display only the reporting items required for each store and campaign
-
Manage photos of your sales floor with location tags to eliminate the need to organize them
Manage photos of your sales floor with location tags to eliminate the need to organize them
-
Be able to respond on the spot at logto inquiries from headquarters or requests for submission of implementation records
Be able to respond on the spot at logto inquiries from headquarters or requests for submission of implementation records
-
Location data is used not for surveillance, but to automate reporting and keep a record of visits.
Location data is used not for surveillance, but to automate reporting and keep a record of visits.
-
-
POINT04
Visualize delivery status and visit priorities on a map
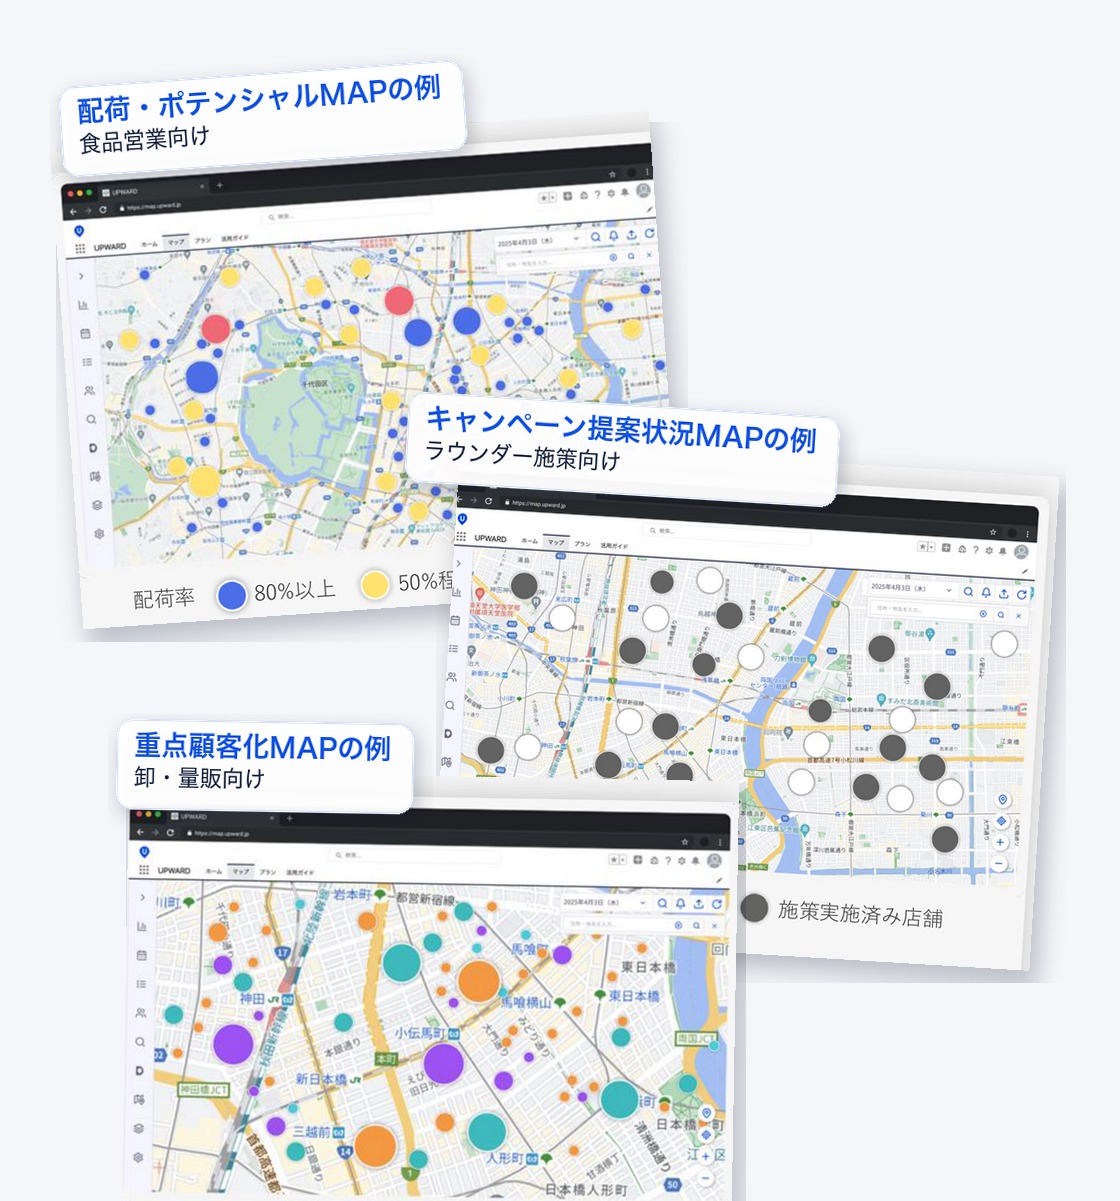
Visualize delivery status and visit priorities on a mapThe delivery rate is indicated by pin color, and the number of days since the last visit is shown by pin size. You can see at a glance where to visit and for what purpose.
This allows you to plan your route according to your strategy, such as prioritizing stops with lower delivery rates.-
Identify Customers Who Haven't Adopted the Service Using the Delivery and Potential Map
Identify Customers Who Haven't Adopted the Service Using the Delivery and Potential Map
-
Use the Key Account Map to Identify Which Clients to Focus on Next
Use the Key Account Map to Identify Which Clients to Focus on Next
-
Use colors to distinguish between implemented and unimplemented measures
Use colors to distinguish between implemented and unimplemented measures
-
Use the "Preventing Long-Term Disconnection" Map to Identify Key Clients You Haven't Contacted in a Long Time
Use the "Preventing Long-Term Disconnection" Map to Identify Key Clients You Haven't Contacted in a Long Time
-
-
POINT05
The AI suggests places to visit during free time, helping to attract new customers
The AI suggests places to visit during free time, helping to attract new customersBased on customer importance, sales strategy, location data, and travel time, AI suggests potential client visits. You can incorporate nearby untapped prospects into your existing sales route.
By making a series of short visits before and after appointments, you can increase the frequency of customer interactions.-
Automatically generates the optimal route, taking travel time into account
Automatically generates the optimal route, taking travel time into account
-
Suggest nearby untapped locations and priority stores during downtime
Suggest nearby untapped locations and priority stores during downtime
-
Increase the Frequency of Interaction Through Drop-In Visits
Increase the Frequency of Interaction Through Drop-In Visits
-
You can insert new routes without disrupting the existing ones
You can insert new routes without disrupting the existing ones
-
-
POINT06
From Case Management to “Support for Next Steps”
From Case Management to “Support for Next Steps”For example, the quality of store layout, productivity in your assigned area, operational efficiency, and the depth of relationships with business partners. By visualizing these key metrics on a dashboard, you can shift your focus from simply tracking numbers to planning your next steps.
Based on our track record of supporting other companies, we’ll recommend which metrics are best suited for your company.-
Track the adoption rate of new and recommended products
Track the adoption rate of new and recommended products
-
Visualizing the Implementation Rate of Promotional and In-Store Initiatives
Visualizing the Implementation Rate of Promotional and In-Store Initiatives
-
Determine staff allocation by comparing visit coverage rates by area and revenue contribution per visit
Determine staff allocation by comparing visit coverage rates by area and revenue contribution per visit
-
Measuring the depth of customer engagement based on the number of sales leads generated and the conversion rate to sales opportunities
Measuring the depth of customer engagement based on the number of sales leads generated and the conversion rate to sales opportunities

-






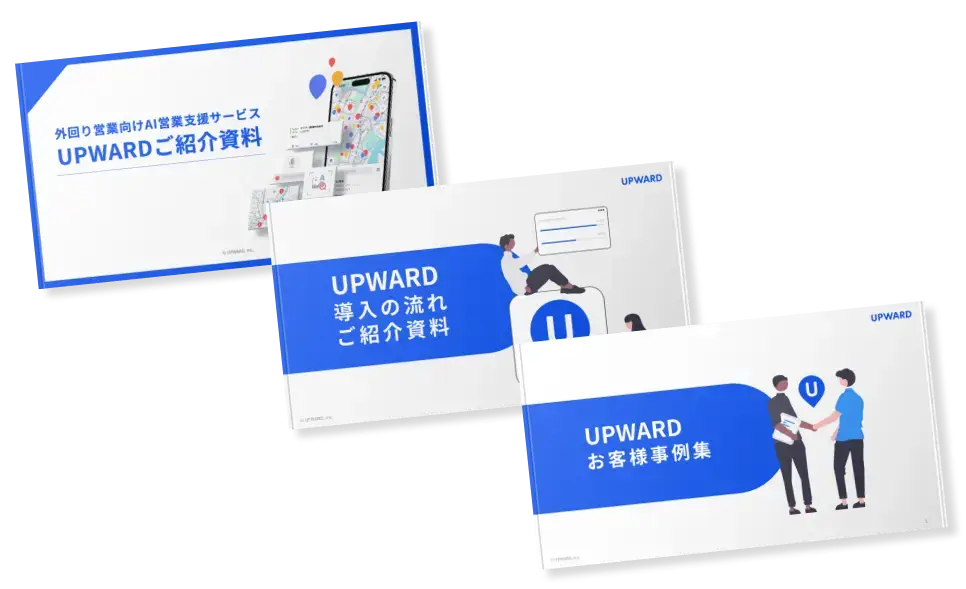
A full overview of the benefits and best practices of the introduction of the system
Download a free set of 3 documents